Trends: Turnover margin is critical, but unpredictable

Advertisement
Click Here to view this Link.

Click Here to view this Link.

Click Here to view this Link.
Ask almost any college football coach, and he'll tell you turnover margin is one of the most telling statistics in the game. The 11 FBS schools that were +13 or better in turnover margin in 2013 went a combined 121-27. The top 22 FBS teams in turnover margin in 2013 all finished with a winning record.
But it's also one of the most difficult statistics to maintain. None of those 11 teams ranked in the top 10 in turnover margin in 2012. Louisville, playing against a softened Big East and AAC schedule, is the only school in the country to be at least +10 in turnover margin in each of the last two years.
Need more proof? Missouri was +1 in turnover margin in 2012 while limping to a 5-7 finish. The Tigers improved to +16 in 2013, fourth best in the nation as they went 12-2, winning the SEC East. Florida went 11-2 in 2012 with a +15 turnover margin (7th nationally), then collapsed to 4-8 in 2013 with a -2 margin. Florida State finished +17 in 2013 en route to a national championship, tied for second in the nation.
Turnovers are finicky, though. The difference between a routine pass deflection and a game-changing interception is minute, but the difference in impact is massive. On one play, a quarterback may fall on a fumble and save a drive. On another play, a defensive lineman is scooping it up and rumbling for a touchdown that crushes momentum.
For our purposes, turnover margin will only measure fumbles and interceptions gained and lost and will not include fourth down stops.
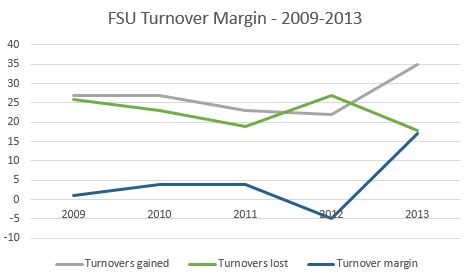
Houston, which led the nation in turnover margin with a +25 margin in 2013, was -4 (83rd) just a year ago. FSU went from -5 to +17 in that same time span. The Seminoles had never been better than +4 under head coach Jimbo Fisher before last year.
One reason why turnover margin is so difficult to maintain is the multitude of factors that play into it. A strong pass rush in one year might fluster quarterbacks into interceptions. Changing quarterbacks, centers or running backs might lead to an increase in fumbles. That's not even to mention the fluky bounces that remain a constant.
If there is positive for Florida State, it's that much of its turnover production from a year ago returns. Lamarcus Joyner and Terrence Brooks have left a secondary that led the nation with a school-record 26 interceptions, but they had just two picks each in 2013 (Telvin Smith and Christian Jones, also in the NFL, had four more). The secondary is largely intact, and the schedule is stocked with inexperienced opposing quarterbacks.
Just as big is the return of Jameis Winston. The redshirt freshman had 10 interceptions in his first year as a starter, the same number E.J. Manuel had in his senior year. The Seminole offense made massive strides in ball security last year, losing five fumbles in 2013 compared to 17 in 2012. They were among the 10 worst in the country in 2012, among the 10 best in 2013. FSU didn't have a single game with a negative turnover margin last year.
With all that in mind, expect some regression to the mean. Florida State's average turnover margin from 2009-12 was an exceedingly average +1 before spiking to +17 for last year's championship run.
If Charles Kelly and the fearsome secondary can keep up the torrid pace set last year by Jeremy Pruitt's unit, the defense will keep generating extra possessions for FSU's offense to slam the door on teams. If Winston maintains or improves his decision-making and Karlos Williams is as reliable as Devonta Freeman, the offense should keep moving forward.
There's no reason to expect FSU to crumble into negative numbers in 2014, but it's also hard to see the Seminoles continuing at last year's pace. Another year like 2014 would set the Seminoles up for another national championship, but that's a tall order.
Turnover margin is among the most important statistics in college football; but there may not be any statistic that's more difficult to predict.
2013
Turnovers lost: 18
Turnovers gained: 35
Turnover margin: +17
2012
Turnovers lost: 27
Turnovers gained: 22
Turnover margin: -5
2011
Turnovers lost: 19
Turnovers gained: 23
Turnover margin: +4
2010
Turnovers lost: 23
Turnovers gained: 27
Turnover margin: +4
2009
Turnovers lost: 26
Turnovers gained: 27
Turnover margin: +1