Clark column: With high-tech software, FSU embraces science of baseball
It's hard to explain just how much information it provides.
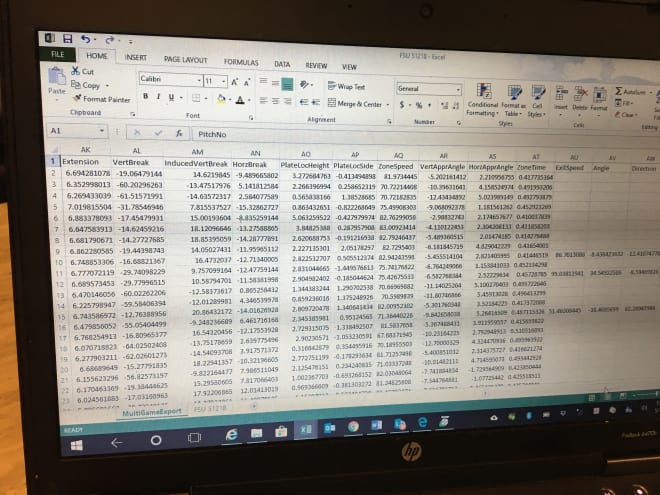
You'd have to see the spread sheets. All the rows. All the columns. All the numbers that seem like you would need a degree in advanced mathematics to fully understand.
Mike Bell doesn't have one of those, but the Florida State pitching coach still knows what he's looking for.
He is familiar enough with the TrackMan software -- which originally was a Doppler radar system developed for military purposes before being used for both golf and baseball -- to know what most of the numbers mean.
Though he admits that wasn't necessarily the case when it was first installed four years ago.
"I had no idea," Bell said. "I had to learn some of that stuff. And I'm still learning. That's the biggest thing. ... You didn't have a way to calculate any of this until this product started coming out. You were more worried about miles per hour.
"Now you can get more into the science."
In 2015, Florida State was one of the pilot programs to use the software.
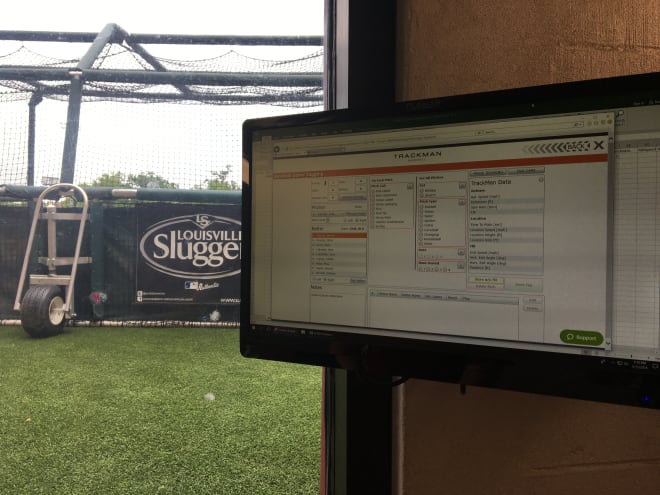
If you've ever been to Dick Howser Stadium, you might have seen a large, black, TV-shaped device outside of the press box. It's the radar that provides the information TrackMan compiles.
And here's how it works.
On every pitch of every game, the Doppler radar tracks the velocity of the pitch and where it crosses the plate ... as well as about a thousand other things.
It tracks the speed of the pitch when it leaves the pitcher's hand and when it crosses the plate. It tracks the launch angle of the ball off the bat. It tracks the extension of the pitcher's arm when the ball is released -- was he 58 feet from home plate or 55 feet?
It tracks how far the ball travels (so far, Jackson Lueck has the longest hit of the season for the Seminoles -- a 449-foot home run) after contact.
It tracks how far a pitched ball moves both vertically and horizontally -- from the time it's released until it crosses the plate.
Every single pitch. Of every single home game.
That data is collected by the TrackMan software and recorded by FSU team managers sitting behind home plate. It's also collected and sent out to the participating schools in a bi-weekly report.
There are so many numbers it can make you dizzy.
But out of all the data that's collected, the two things that correlate most to success are: Spin rate for pitchers and exit velocity for hitters.
By and large, the faster spin rate you have, the more swings and misses you're going to get. And, quite obviously, the faster a ball comes off your bat, the better chance you have to get a hit.
It's that first category, though, that Bell cares the most about. And why TrackMan was so illuminating for him.
"UCF had a guy last year who would come out of the bullpen and just throw fastballs," Bell said. "He struck a (boatload) of people out. And you'd go, 'What's going on here, man? Why can't you hit his fastball?'
"Well, No. 1, his extension -- where he was releasing the ball -- was closer to the plate than the average pitcher. He also had a high spin rate. A fastball with a high spin rate usually has a little giddy-up at the end of it. Low-spin-rate guys are sinker-ball guys."
So the mystery of the UCF reliever was solved by TrackMan, which is now being used in every Major League Baseball stadium and most minor-league parks. It's now used by scores of college baseball teams, some high school teams, and (amazingly) more than a few 13-and-under and 14-and-under travel ball teams.
It's obviously a tremendous resource for recruiters and scouts. Instead of just looking at radar gun readings, it can help explain why and how one pitcher is getting more swings-and-misses than another -- even though they both throw the same speed.
It's (almost) all about the spin rate.
Case in point: The average spin rate of a major-league change-up is around 1,700 rotations per minute. FSU pitcher Tyler Holton's change-up is 1,823 rpms. That's why it seemed almost unhittable at times last season. It was getting more movement, more late movement, than most major-league change-ups.
Bell already knew it was a great pitch. He saw all the swings-and-misses. Now, he has the empirical data to explain why.
"A lot of the (recruiting) events we go to have it," Bell said. "And that can tell you, 'Hey, that 90 mile-per-hour there is a lot better than that 90 mile-per-hour fastball there.' Sometimes, it's spin rate. It helps if you're trying to figure out why this guy here is punching out 12 a game. There's something to it. Is it deception? Is it extension? Is it spin rate?
"There's different factors that come into play. It's just another tool for us to use. Another avenue."
I'm sure there's a segment of the baseball fan base that just rolls their eyes at these kinds of analytics. It's almost like taking a great sport and turning it into some sort of nerdy science project.
But this is definitely the future. Go into any Major League Baseball park now, and you'll see exit velocities (by the way, the hardest hit ball of the season by an FSU player was a 113-mile-per-hour ground ball by Kyle Cavanaugh) and launch angles displayed on video boards.
Even if you can't bring yourself to care about spin rates and tilt angles and exit velocities, this stuff is the future. And Florida State was on the forefront.
Because so many scouts come to Dick Howser Stadium through the course of a season, TrackMan wanted FSU to be one of the pilot programs. That way, scouts could get the readings after a game and delve into the numbers.
The data helps the Seminoles as well. Bell has a stack of spreadsheets at his disposal, and he gets a detailed report from the FSU managers immediately after each game.
It helps him work with the pitchers and determine which pitches are getting the most movement, which pitches tend to flatten out over the course of a game and whether a player is using his normal arm action in a big moment.
The same goes for hitting coach Mike Martin Jr. Not only can he see exit velocity for each batted ball, but he can figure out which portion of the strike zone his hitters have the most success with hard contact -- and which portion produces the most swings-and-misses or weak contact.
TrackMan doesn't teach spin rate, of course. And it doesn't help a player produce rocket-like exit velocities. It just tracks those numbers.
And tonight, when Florida State is taking on N.C. State in a pivotal ACC series, it will once again be producing a staggering amount of data for the FSU baseball coaches to use.
"I think it started out with three ACC and three SEC teams," Bell said of the initial pilot project. "The idea behind it was they wanted to provide data to major-league teams. So if you had Luke Weaver vs. Carlos Rondon here on a Friday night, they were going to get more information than just, 'Hey, these guys are throwing hard.'
"And once their product got out there, now you've had all the major-league teams buy it. Because it can really help with the day-to-day development with your guys, getting them information, getting them that feedback. 'Am I gaining velocity? How am I getting better?'
"Everybody wants information, and they want it now."
Contact senior writer Corey Clark at corey@warchant.com and follow @Corey_Clark on Twitter.
---------------------------
Discuss this story with other FSU fans on the Seminole Baseball Message Board.