FSU won red-zone challenge vs. impressive Duke defense

Football experts hold Mike Elko in high esteem as a coach and assert Duke’s defense is a stern test for any offense. Saturday was an interesting head-to-head matchup between the 2022 ACC Coach of the Year and a candidate for the 2023 Bear Bryant Coach of the Year Award and FSU’s Mike Norvell, who is also a candidate for both of those awards.
Elko’s name is on the lips of fans at Michigan State who would love to have the former Texas A&M defensive coordinator fill their open head coaching seat. According to the message boards, Aggieland would also love to bring Elko back if Jimbo Fisher is unable to show progress in the win column.
We agree Elko and his Duke defense are legit. Statistically, they were excellent coming into the Florida State weekend, ranked No. 2 in red-zone stops and No. 3 in stopping overall possessions. Both stats were earned against a credible schedule including Notre Dame, Clemson and NC State.
So, let’s look at those two important defensive measurements to see how Norvell’s Florida State offense fared against Elko’s Duke defense?
Red zone defense
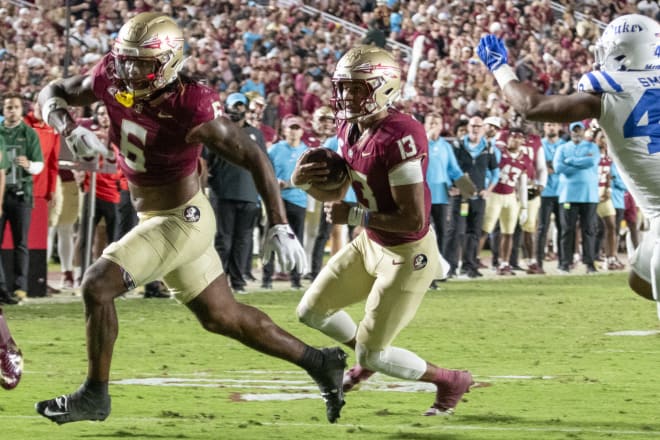
Prior to playing FSU, the Blue Devils’ defense kept offenses off the board 7 of 13 times (53.85 percent) inside the red zone (goal line to 20-yard line), which is second only to Michigan. On Saturday, Jordan Travis led the Seminoles into the red zone five times and scored on all five trips (4 TDs and 1 field goal).
That’s a remarkable number, especially when you look at how other Football Bowl Subdivision (FBS) teams fared in the chart below.
While the previous FBS opponents averaged scoring on 46.2 percent of red-zone possessions, FSU converted on 100 percent. Think about that! And think about this, those four scores are more than half as many as the previous five offenses scored collectively on this defense.
Here’s how those five FBS opponents fared in the red zone:
| Opponent | RZ possessions | RZ scores | RZ percentage |
|---|---|---|---|
|
Notre Dame |
4 |
1 TD, 2 FG |
75 percent |
|
Connecticut |
2 |
1 TD |
50 percent |
|
Northwestern |
4 |
2 TDs |
50 percent |
|
Clemson |
5 |
1 TD |
20 percent |
|
NC State |
1 |
0 |
0 percent |
|
Average |
16 |
7 |
43.75 percent |
|
Florida State |
4 |
3 TD, 1 FG |
100 percent |
Stop rate
Last week we wrote about the Stop Rate Ranking where Duke’s defense was ranked No. 3 nationally. The Stop Rate is a simple measure of the percentage of times a defense forces a stop, whether a punt, interception or fumble, or a turnover on downs. The Stop Rate also ranks defenses in terms of points surrendered per possession.
Prior to the game, Duke’s defense had taken the field 56 times against those FBS teams and stopped opponents 47 times (83.9 percent), which means opposing offenses scored about once every six possessions. That’s about two scores per game if you get 12 possessions. FSU only had 10 possessions, but they scored on five of them (50 percent), which is an unusually high percentage against this Duke defense.
Give the quarterback credit for consistently navigating this offense to 24 points in the Redzone, which is 2,5 times the average points (0.93 points per possession) surrendered by Duke thus far this season.
| Team | Possessions / Stops | Stop rate | Points / possession |
|---|---|---|---|
|
Clemson |
13 / 12 |
92.3 |
7 / 0.538 |
|
Connecticut |
13 / 12 |
92.3 |
7 / 0.538 |
|
NC State |
11 / 10 |
90.9 |
3 / 0.25 |
|
Northwestern |
9 / 7 |
77.8 |
14 / 1.55 |
|
Notre Dame |
10 / 6 |
60.0 |
21 / 1.75 |
|
Total / Avg. |
56 / 47 |
83.9 |
52 / 0.928 |
|
Florida State |
10 / 5 |
50.0 |
24/2.4 |
Assessing the FSU offense against Duke
If we are going to lift Elko and his Duke defense up, and we should, then what does that say about Norvell’s offense, which was perfect in the red zone, enjoyed more success on 10 possessions than others and scored significantly more points (31 compared to a 9.8-point average). Plus, FSU scored another seven points on the kickoff return that are counted as special team's points and not for FSU’s offense or against Duke’s defense.
Looking beyond the Stop Rate and red-zone performance, FSU’s offensive output exceeded Duke’s defensive average in 19 of 21 categories, most dramatically in points (38 vs. 9.8 ppg.), rushing TDs (2 vs. 0.66 TD/game), passing TDs (2 versus 0.50 TD/game), total offense (420 vs. 298.5 ypg), average yards per play (6.17 vs. 4.4 ypc.), passing yards (268 vs. 164.7 ypg.) and average per rush (4.8 versus 4.0 ypc).
Those numbers are impressive against Duke and bode well for FSU's offense against upcoming defenses.
Jordan Travis' numbers were also good
While Travis threw a few passes he’d like to have back, it should not go unnoticed he completed 75 percent of 36 passes for 268 yards and two touchdowns against a team that ranks No. 8 in passing efficiency defense. Travis also accounted for 330 total yards and three touchdowns on 46 plays (36 passes and 10 rushes) for 7.17 yards per play.
While there was some nervous grumbling in the stadium and on the message boards during FSU’s hard-fought first half, the Seminoles eventually scored 38 against this Duke defense, the 13th straight time FSU has scored 30 or more points and the 13th straight victory Travis has led.
Travis is ranked No.26 in passing efficiency and second among quarterbacks in the ACC behind Miami’s Tyler Van Dyke.
Here’s where the ACC quarterbacks are ranked nationally in passing efficiency offense behind LSU’s Jayden Daniels, who is ranked No. 1 nationally with a rating of 204.32.
| Rank | QB, school | Pass efficiency rating |
|---|---|---|
|
8 |
Tyler Van Dyke, Miami |
171.8 |
|
26 |
Jordan Travis, FSU |
153.44 |
|
27 |
Jack Plummer, Louisville |
153.17 |
|
31 |
Drake Maye, North Carolina |
151.97 |
|
42 |
Haynes King, Georgia Tech |
145.85 |
|
58 |
Cade Klubnik, Clemson |
136.62 |
|
60 |
Garrett Shrader, Syracuse |
135.51 |
|
65 |
Thomas Castellanos, BC |
133.94 |
|
74 |
Mitch Griffis, Wake Forest |
129.84 |
|
78 |
Kyron Drones, Virginia Tech |
128.27 |
|
84 |
Riley Leonard, Duke |
122.75 |
|
101 |
Brennan Armstrong, NC State |
112.54 |
| Duke defense | Before | FSU |
|---|---|---|
|
Points per game |
9.8 |
38 |
|
First downs |
18.5 |
24 |
|
- Rushing |
8.67 |
9 |
|
- Passing |
9 |
14 |
|
- Penalty |
0.83 |
1 |
|
Rushing yardage |
133.83 |
152 |
|
Yards gained rushing |
160.33 |
164 |
|
Yards lost rushing |
26.5 |
12 |
|
Rushing yards |
133.83 |
152 |
|
Yards gained rushing |
160.33 |
164 |
|
Yards lost rushing |
26.5 |
12 |
|
Rushing attempts |
34.33 |
32 |
|
Average per rush |
4.0 |
4.8 |
|
Average per game |
164.7 |
268 |
|
Completions |
18.3 |
27 |
|
Attempts |
36.7 |
36 |
|
Interceptions |
0.83 |
1.0 |
|
Average per pass |
4.9 |
7.4 |
|
Average per catch |
9.0 |
9.93 |
|
TDs passing |
0.5 |
2 |
|
Total offense |
298.5 |
420 |
|
Total plays |
67.5 |
68 |
|
Average per play |
4.4 |
6.17 |
Follow The Osceola on Facebook
Follow The Osceola on Twitter
Subscribe to the Osceola's YouTube channel
Subscribe to the Osceola's podcasts on Apple
Subscribe to the Osceola's podcasts on Spotify